


Ricky Bobby's Trading Playbook June 1th, 2025 V1.3
Lets do this!

Changes V.1.3 (June 1st,2025):
Eliminated 9EMA references. Will simplify to just 20EMA on intraday timeframes.
In timeframe, added note to not trade in the first 30 minutes of the day to let patterns form.
Added Trade Setup Analysis tool to Trade plan to filter out bad patterns in real time.
Updated Primary Trading Objective
Primary Trading Objective
June goal is to have meet the following goals:
At least 80% of trades be A+ and A patterns.
Not modify my SL or PTs once set in, unless it is per plan.
Use new tool for all potential trade evaluations.
Time Frame
Time of Day to Enter Trade: Regular Trading Session
Avoid trading in the first 30 minutes of the day to let patterns play out and breakout of stage 1 or stage 3 cycles, to catch a stage 2 climb or stage 4 dip. Possible exception of level 1 professional or novice gaps on catalyst, where the opening drive is expected to be very strong.
Charts in Das Trader for any given ticker to be traded need to have the following timeframes:
1min - pay attention to price crossing/touching 20 EMA.
2min-pay attention to price crossing/touching 20EMA.
5min- price does not necessarily need to touch 20EMA, and can have 1 bar pullbacks.
15min-
60 min-
Daily- pay attention if price gaps down to 9ema price, for potential longs. Pay attention to important Levels.
Weekly- pay attention to Important levels.
Days to Trade
Trading Days: Monday- Friday
Asset Class to Trade
At this point in time, I will focus only on Equities based off my scanners.
Stock Selection Criteria
Determine Market Bias on QQQ & SPY.
If gapping up or down, and outside candle. Sign to be agressive.
if gapping inside the previous day’s candle. Sign to be cautious.
Review if any significant Economic indicators are going to be released in the market open and/or mid-day.
Run Gap Scanners in the morning in Trade Ideas.
Determine if Gaps are novice and professional in nature.
Determine if Gapping Stocks have a catalyst such as earnings, breaking news, government investigation, or other.
Rank Gaps as L1, L2, or L3 to the long or shortside.
What is the short-term pattern?
What is the relative location with respect to relative support and resistance?
What is the size of the Gap?
What is the long-term pattern?
What is the relative strength to the market?
Draw Levels in the market for the top stocks, to identify potential support and resistance.
Only Enter Trades from Gap List, do not deviate from Gap List.
Do not trade inside daily candles.
Risk Management / Account & Position Sizing
Risk Value per Trade: 10 USD (hard coded into hot buttons)
Max Daily Drawdown: 3R (Hard coded into Das)
Daily Target: 2R to 4R (If i hit green on the 1st trade, i have the option to call it a day. If market is hot, I am willing to take a 2nd trade. Will not lose more than 1R. Will end day green if I win the first trade 2R, and lose the 2nd trade 1R, gross 1R.)
Weekly Target: Be green at least 3 out of the 5 trading days of the week
Monthly Target: Be green at least 3 out of the 4 trading weeks of the month.
Trade Entry Rules
Will use new tool to evaluate Buy Setups as follows:
This tool will use the concepts learned from the folks at Live Traders.

And for Sell Setups:
Tool will be on a 6 point system that will grade trades as A+, A, B, and No Setup. I will look to trade only A+ and A trades in June.
Enter with Long 2R hotkey risking Low of Previous candle Low, and high of previous candle as stop entry. This will prevent us from chasing stocks. ALWAYS, ALWAYS.
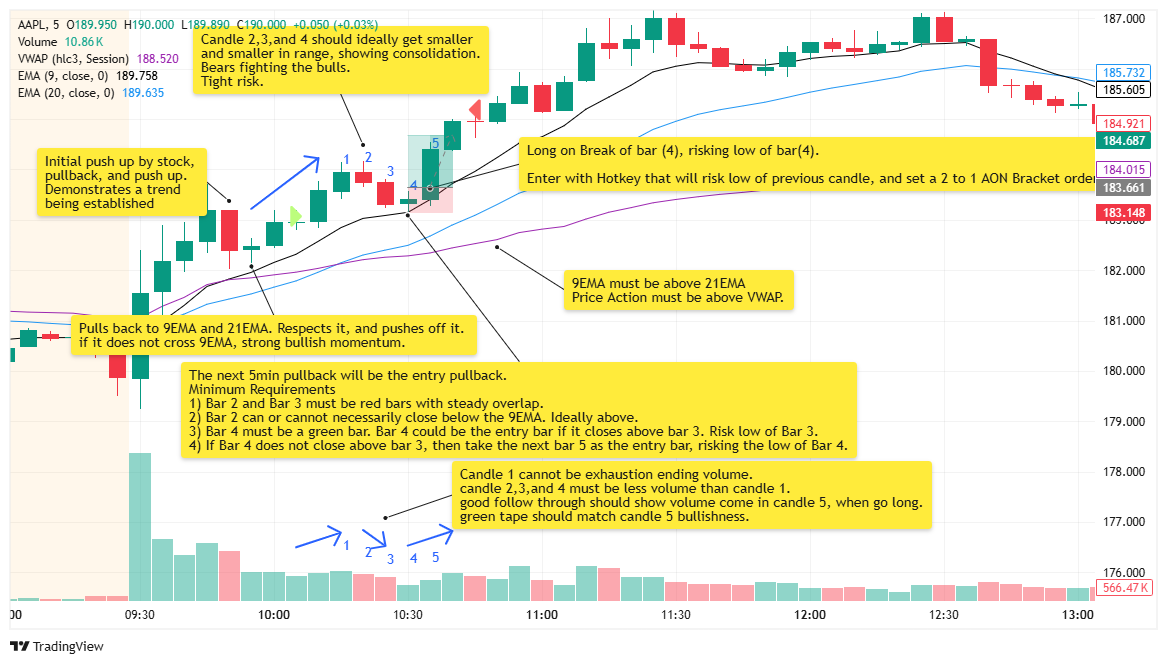
1, 2, and 5min Buy Setup Entry Criteria Per Chart Below (disregard entry and exit triangles)
From previous trades, it is best for 1 min price to pull back to 21EMA and touching. Also 1min price will have a Down Trend Line (DTL) pullback, that eventually breaks.
At the same time, the 2min price action pulls back and touches the 9EMA, and bounces.
The 5min price does not necessarily need to touch EMAs, because price is also pushing up towards next leg. A single bar pullback appears to be acceptable, if lower timeframe ( 1min, and 2 min are already pulled back to 20 ema (1 min chart).
In the case of 1min candles , time the 3rd candle of every set of 5 1-min candles as the potential entry. From feedback from PeterB, there is a trend that candles 1 and 2 are typical dip candles of a pullback of a 5min candle. Will review this in my trades this week.
Enter with Short 2R hotkey risking high of Previous candle high, and low of previous candle as stop entry. This will prevent us from chasing stocks. ALWAYS, ALWAYS.
1, 2 and 5min Sell Setup Entry Criteria Per Chart Below (disregard entry and exit triangles)

Patterns to Trade For now on Stocks with room for 2R targets.
1, 2 & 5 min Buy Setups (BS)
1, 2 & 5 min Sell Setups (SS)
Trade Exit Rules
1 profit targets at 2R 100% AON.
If i make a mistake in realtime, I give myself permission to bail out of a position long or short.
Potential bail out mistakes include: buying a breakout/breakdown, not letting ticker setup properly, or trading an inside daily candle.
I will allow myself to bring my stop to breakeven or 1R profit if I am approaching end of day (3:48pm EST), and imbalances report could potentially cause my unrealized profit to be lost.
Trade Analysis
Track Trades in Tradersync. This is to be done on daily, upon importing trades around lunch time, or after work.
Review If trade had any mistakes that violate rules in diagram above.
I will on a weekly basis run a weekly report analyzing mistakes made during the trading week, and analyze alternate trading methods ( 1R AON, 2R AON, 3R AON, Sell 1/2 at 1R, bring stop to B/E, and sell rest at 2R, and my actual trade performance.) This report will give me and indication if I am following my plan ( 2R AON, and give me an indication if the market is having follow through on my setups vs other trade methods.
I will also go back and analyze each trade at the end of the week to see if i see any additional nuances that could have an impact in my trade Entry rules.
Trade Management
I will have open risk more than 1R at a time. If I lose the first trade, I will attempt a 2nd trade. If the 2nd trade goes red. I am done for the day. My max loss day will not exceed -2R.
Cap Trades per Day: 5 trades (max theoretical gain: 10R)
If i have reached daily target, i will not give more than 1R from the max.
Scale Profitable Trading System Methodology
I will trade daily per trade rules
I will journal all my day trades
identify if rules were followed, setups were clean, and if mistakes were made.
If I am consistently making 2 to 4 R a day for at least the next two months, I will consider a risk bump on July 15th.
I will need to adapt or refine by increasing or decreasing risk, adjusting setups, to determine what is making money, and what is not making money.
TRADE→JOURNAL→REFINE→TRADE→JOURNAL→REFINE→SCALE RISK→TRADE→JOURNAL→… REPEAT.
Charts
I will primarily trade on the following charts: 2min & 5min.
To check for levels, I will use the Hourly, Daily and Weekly to find levels of support and resistance.
My indicators are the following on lower timeframe charts:
20 EMA ( light blue)
200 EMA (green)
VWAP ( Purple)